 |
New Product Announcement
Hartmann Mask Analysis Software
For SBIG CCD Cameras
February 16, 1999
|
SBIG’s new Hartmann mask analysis software enables the user to collimate his
telescope and measure the wavefront accuracy of the system. To make the measurement,
the user fabricates a simple mask for the front aperture of the telescope, and collects
data with an SBIG camera (ST-4, ST-4X, ST-5, ST-5C, ST-6, or ST-7/8). Two mask
designs are recommended and sample designs with instructions are provided with the
software. One mask design is best for initial experimentation and collimation of
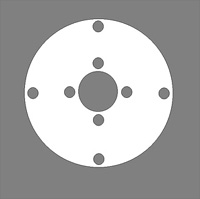
your system. Figure 1 shows a sample of the first design with an additional cut out
in the center to fit over the secondary of a Schmidt-Cassegrain telescope. A sample
image taken with this type of mask is also shown. Two sets of holes at different
diameters are arranged around the aperture. The second type of mask design uses many
more holes (e.g., Fig 3) and is good for characterization of the optical system wavefront
error after alignment is complete. The holes need not be very precisely located,
round, or even cleanly cut. Images are collected inside and outside of focus and the
analysis software is then used to determine the aberration of the system.
 |
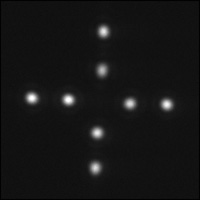 |
Figure 1 |
|
The theory behind the Hartmann mask technique is as follows: Rays from a distant
star are focused into a small spot by the optical system. Because of aberrations in the
system the rays may not all pass through a single point. If one determines the
positions of the rays on both sides of focus, one can trace the rays through the region of
best focus to determine the smallest spot size (Fig. 2). To perform this
measurement, the aperture is covered by a mask with an array of small holes, and CCD
images are taken of the resulting pattern on each side of focus. It is important
that the CCD be enough out of focus that no ambiguity results in trying to determine which
spot in image A corresponds to the same ray as a spot in image B.
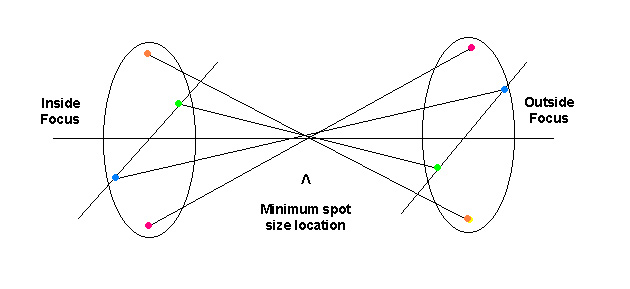 |
Figure 2 |
To collect the Hartmann data, one covers the aperture with the mask, points the telescope at a bright star high in the sky, and takes about a five to ten second exposure of the pattern on each side of focus. The exposure length should be long enough that centroid wander of the spots relative to each other due to seeing (which varies across the aperture) is minimized, but short enough that tracking problems are not smearing the spots. The spot pattern should comfortably fill the 200 x 200 pixel box, without truncating the edge spots (Fig. 3).
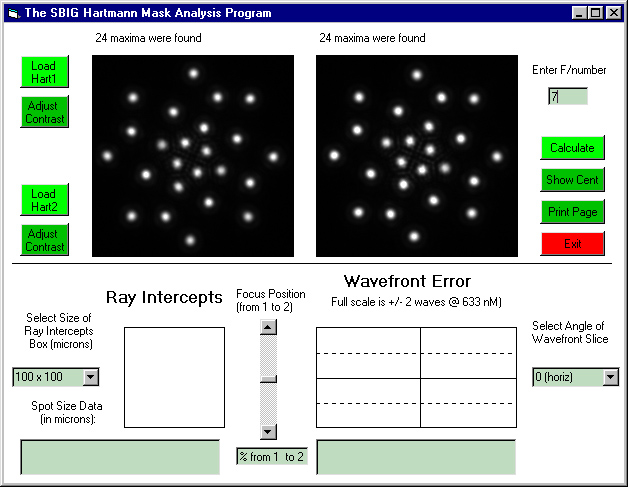 |
Figure 3 |
Analysis of the resulting images are performed by loading the two images, inside and
outside focus, and when the CALCULATE button is selected, the software then automatically
displays the spot diagram and the wavefront at the point of best focus (Fig. 4).
 |
Figure 4 |
Using the vertical scroll bar next to the raytrace box you can see how the pattern changes
as you go through focus. You can set the raytrace box size (full width) with the
control to its right. The wavefront will also change as you do this (Fig. 5).
Pure defocus produces a quadratic wavefront error which adds to the inherent error of the
system. You can examine the wavefront error in any one of four planes (slices) using
the control to the right of the wavefront graph. Astigmatism will show up as a different
focus between two orthogonal planes.
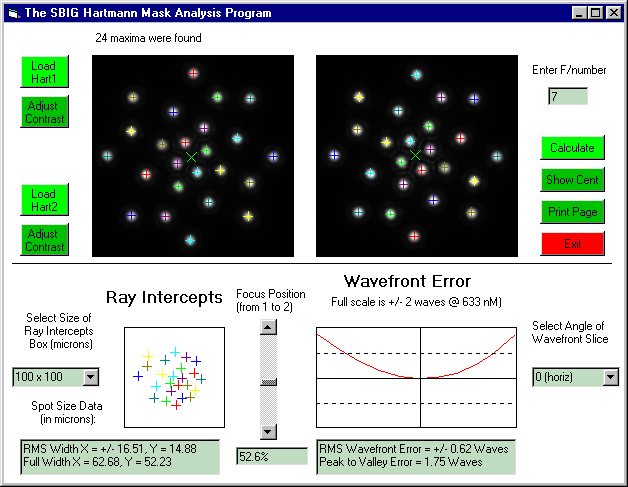 |
Figure 5 |
When finished, you can hit PRINT to dump the screen to a printer. You can also
examine the centroid position for each spot calculated by the program by repetitively
toggling the SHOW CENTROIDS button. The values are referenced to the geometric
center of the pattern. This is useful when you suspect the program did not properly
match the spots. If the program does not properly match the spots, that ray (and
associated wavefront error) can be greatly in error.
Interpreting the Results:
Good results with this program requires care. You should take multiple images take get an idea of the scatter in the results due to atmospheric turbulence (seeing). If you take short (0.1 second) exposures you should see an optical quality degradation on an average night. You can use this ability to measure your seeing in terms of both spot size and wavefront error.
When using the second type of mask, the spots should all converge to a single point for perfect optics. If the outer ring of spots focuses at a different point than the inner ring, you have spherical aberration. If the outer ring spot group’s center is displaced sideways from the inner ring’s center, you have coma. If the vertical row of spots focuses at a different point than the horizontal row of spots, then you have astigmatism. Of course, if you have some combination of these three aberrations, then the patterns get more complicated.
Note: the purpose of SBIG selling this software is not to enable the telescope users of the world to confront telescope manufacturers over their quality. We believe that most manufacturers ship products that meet their specification. However, by the time you use it, the shippers have banged it around, the cold night may have distorted the optical elements, tube currents are flowing in the tube, and the seeing may be bad. Our purpose in selling this software is to help you quantify your system, and hopefully reduce some of these troublesome effects to where you can achieve performance limited only by the optics on those rare nights when the seeing allows it.
Price is $99. You can order directly from our web site by clicking here.
Revised: October 29, 1999 04:50:08 PM.
Copyright © 1998 Santa Barbara Instrument Group, Inc. All rights reserved.
Please report any problems with this page directly to the Webmaster