 |
MODEL SGS
SELF-GUIDING SPECTROGRAPH
|
 |
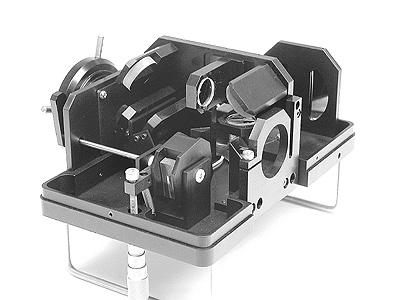
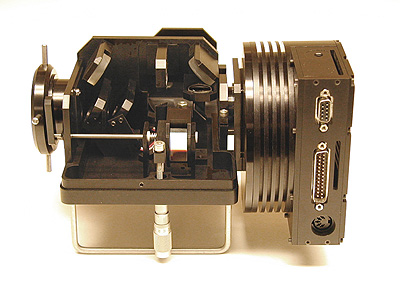
The Self-Guiding Spectrograph is designed to be used with an ST-7E camera. Although it can also be used with an ST-8E, there is no advantage in bandwidth when using the larger format camera. The spectrometer and ST-7/8 are coupled and mounted as a unit onto the telescope (See Figure 1). The system is quite handy for collecting spectra since both the object of interest and the spectrometer entrance slit are simultaneously imaged onto the tracking CCD, allowing the object to be viewed and accurately placed onto the slit. The slit is backlit by an LED during the setup so it clearly shows on the tracking CCD. Once the object is maneuvered onto the slit, self guiding will then hold the object on the slit.
For a review of the spectrograph by Sky & telescope click here to visit Sky & Telescope's web site.
| Overview of SBIG's Self-Guided Spectrograph Capabilities | |
| Measure Stellar
Spectra: - Determine spectral class - Measure radial velocities |
Figures 2, 3, 9, 10 |
| Measure Emission
Nebula: - Determine spectral lines - Measure relative line strengths |
Figures 4, 5 |
| Measure Galactic
Objects: - Measure radial velocity (red shift) of brighter galaxies - Distinguish quasars from other objects |
Figures 6, 7, 8 |
Identify Stellar Spectral Class
Spectrum
of B Class Star |
| Spectrum of G
Class Star |
| Spectrum of M
Class Star |
Figure
2 |
Measure Stellar Radial
Velocities
Stellar Radial
Velocity of Selected Stars |
||
| Star | km/sec* | If you face the celestial equator, straight south at sunset, you are looking BEHIND the earth in orbit (the wind is against your back)! |
| ATAU1 | 88 | |
| ATAU2 | 88 | |
| ATAU3 | 95 | |
| AORI1 | 54 | |
| AORI2 | 51 | |
| AORI3 | 56 | |
| GLEO1 | -15 | |
| GLEO2 | -30 | |
| GLEO3 | -14 | |
| * Uncorrected for earth's orbital velocity | ||
Measure Emission Nebula
The spectra of M57 below was obtained using the low resolution grating and the narrow slit:
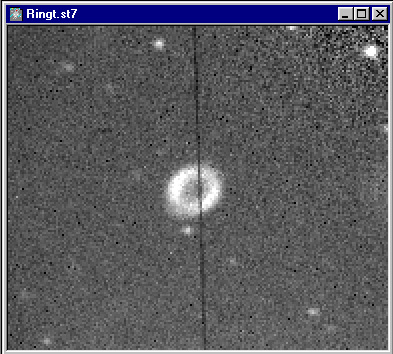 |
Figure 4 |
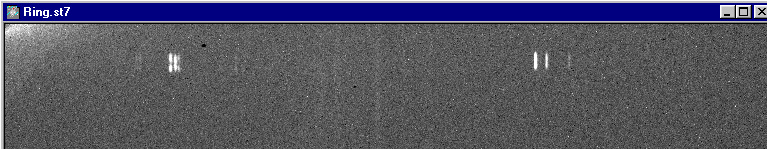 |
Figure 5 |
The
top image (Figure 4) is a screen shot showing the view of the tracking CCD displaying the |
Measure Galactic Objects and Distinguish Quasars
The self-guiding feature of the ST-7/8 camera makes taking long exposures relatively painless and helps to keep the object centered on the slit for extended periods of time. This technique is necessary if one attempts to measure the red shifts of galaxies of emission lines of quasars. The samples below of M104 show the red shift of the galaxy relative to the star Mu UMA:
 |
Figure
6 |
 |
Figure
7 |
 |
Figure
8 |
Obtain High Resolution Spectra
Using the high resolution grating and the narrow slit the spectrograph is capable of resolving narrowly separated lines. The sodium doublet lines in Figure 9 below are easily separated although they are only 6 angstroms apart. The magnesium lines in the three stars shown in Figure 10 are separated by only 5.4 angstroms.
 |
Figure 9 |
 |
Figure 10 |
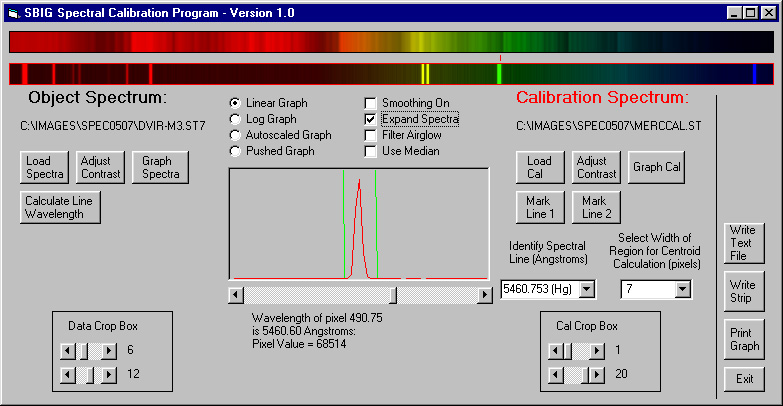
Acquisition and Analysis Software Included
The spectrograph is provided with a special version of CCDOPS for data acquisition and SBIG's Spectral Calibration Program for analysis. These programs make the spectrograph immediately useable as an analytical instrument without the need for the user to write or obtain third party software.
 |
Figure
11 |
Optical Specifications
Dispersion: |
|
| Two gratings are available, on a
carousel for rapid selection - 150 lines per mm (4.3 Angstroms per pixel) - 600 lines per mm (1.0 Angstroms per pixel) |
|
Slit Width |
|
Acceptance cone angle: F/6.3 by F/10 |
|
Resolution: |
|
| Narrow slit & 600 lines/mm | 2.4 Angstroms |
| Narrow slit & 150 lines/mm | 10 Angstroms |
| Wide slit & 600 lines/mm | 10 Angstroms |
| Wide slit & 150 lines/mm | 38 Angstroms |
Relative Sensitivity to Diffuse Sources: |
|
| Narrow slit & 600 lines/mm | 1.0 |
| Narrow slit & 150 lines/mm | 4.0 |
| Wide slit & 600 lines/mm | 4.0 |
| Wide slit & 150 lines/mm | 16.0 |
General Specifications
 |
Figure
12 |
| Description: The spectrometer is designed to operate with the ST-7/8. The object that is to be analyzed is viewed on the tracking CCD, simultaneously with the slit. The slit is backlit by an LED during setup to render it clearly visible on the tracking CCD. The object is manually maneuvered onto the slit using the telescope controls, and is held there using SELF GUIDING during a long exposure. The spectra is recorded by the imaging CCD, oriented long-ways so the spectra falls across 763 pixels, with a height of about 16 pixels for stellar sources. Two gratings and two slits are available for maximum versatility. The standard grating, 150 rulings per mm, gives a dispersion of 4.3 angstroms per pixel, and allows the user to capture the entire interesting range from the calcium H and K lines to H-Alpha with a single exposure. Depending on the slit size, the resolution will be 10 or 38 angstroms per pixel. An interchangeable high resolution grating can also be used that gives 1.07 angstrom per pixel dispersion, with a resolution of about 2.4 angstroms when used with the narrow slit. The spectral range is smaller, being only about 75 angstroms. This resolution is adequate to detect the Doppler shift due to the earth’s motion around the sun when carefully calibrated, and detect spectroscopic binaries. |
| Dispersion: 1.07 or 4.3 Angstroms per pixel |
| Resolution: emission line is recorded with 2.4, 10 or 38 Angstroms Full Width at Half Maximum |
| Spectral coverage per frame: about 750 Angstroms with the high resolution grating, or 3200 with the low resolution grating |
| Center Wavelength Selection: Calibrated Micrometer Adjustment |
| Wavelength Range: 3800 to 7500 Angstroms |
| Sensitivity: Signal to noise ratio of 10:1 for a 9th Mag star, 20 minute exposure using a non-ABG ST-7 and a 10 inch (25 cm) aperture in high resolution mode. An ABG ST-7 will reach magnitude 8. The low resolution mode will be 1.5 magnitudes more sensitive. |
| Entrance Slit: 18 micron (2.3 arcseconds wide with 63 inch focal length telescope) or 72 microns. |
| Dimensions: 3 x 4 x 7 inches (7.5 x 10 x 18 cm) |
| Weight: 3 pounds (with ST-7 head attached) |
| Uses: Stellar Classification Analysis of Nebular Lines Identification of spectroscopic binaries Measurement of Stellar proper motion to +/- 6 km/sec accuracy Measurement of Emission Nebula Proper Motions Spectra of Laboratory and field sources |
| Galactic Red Shifts: When used with the new Kodak "E" detectors red shifts of bright galaxies are possible with amateur sized telescopes. |
| Price: See Current Price List |
Revised: September 16, 2005 04:05:56 PM
Copyright © 1998 Santa Barbara Instrument Group, Inc. All rights reserved.
Please report any problems with this page directly to the Webmaster