
|
 "An entirely different way to study the stars, and with some really cool gear!"
Information and advice about spectroscopy for you, and how to select your own Shelyak instrument
 Spectroscopy: History And A Brief Overview Spectroscopy: History And A Brief Overview
Shelyak Instruments at Company Seven: spectroscopy, in the sense first applied by the pioneering scientists and as facilitated with much higher precision by our Shelyak instruments, includes: observation, recording, and the study of the entire range of the visible spectrum that radiate from a star (yes, our Sun too) and combine to form white light. For many years before Company Seven commenced distributing Shelyak Instruments product line, at least as far as around 2006, we were acquainted with their fine equipment and we often recommended their instruments to our clients including amateurs, schools and astronomy clubs too. In the Fall of 2015 we were asked by a research agency to provide Shelyak equipment that we had recommended to them, but instead of buying direct or elsewhere they insisted in buying through Company Seven or not at all; that was pretty high praise for us. That was the instance where we came to realize that Company Seven should develop a working relationship with Shelyak, and offer their fine instruments to our clientele.
The spectrometer (or spectrograph) is a device used to observe or with the aid of a camera or other equipment to record spectra; spectroscopy is the use of a spectrometer to perform chemical analysis of the radiative energy involved in the interactions at the source of that energy. Sometimes equipment can be optimized for specific applications, for example the spectrohelioscope was devised to study the spectrum of the Sun. Shelyak Instruments are well at home in Universities and at government research laboratories. However,
Shelyak has not only developed affordable precision instruments, but by spreading knowledge
they are popularizing a niche of scientific astronomy. They truly are making a positive impact
among the amateur and educational communities.
There are many fine articles readily available to those who seek to learn more about spectrographs and spectroscopy, a number of the excellent introductory and instructional articles are being added to our Shelyak Notes & Interesting Articles section, so we will not provide an in-depth review here. But for those seeking a brief explanation:
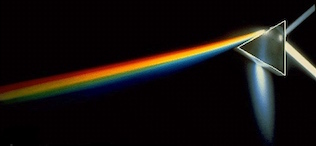 What Is It? The word spectrum is derived from the Latin terms specter, meaning “an image or apparition”, and from specere meaning “to observe”. It was in the 17th century, certainly an age of discovery, when the term spectrum was first applied in the field of optics. Sir Issac Newton experimented with optical lenses and mirrors, and it was he who with pair of simple prisms in 1666 first reasoned how sunlight was composed of many colors. He came to define spectrum as the continuous spectrum rainbow of colors which appear when white light is passing through a dispersive glass prism and becomes separated into its component (pure) colors. By 1704 Sir Issac had accumulated enough new knowledge to publish Opticks, that included a detailed study of the dispersion and recombining of colors by prisms among other subjects.
Right: glass prism demonstration of white light and its dispersion into component colors (28,448 bytes).
The range of visible colors of the spectrum span from the upper range of the ultraviolet at about 370nm, continuing up through the blue, green, reds, and into the deep red at about 700nm where the infrared spectrum commences. Spectral lines are produced by the emission of or by the absorption of energy in the form of light. These darker (absorption) or lighter (emission) wavelength spectral lines have a precise location on the spectrum that is caused by electrically charged atoms or a group of atoms (molecule) correlating to specific elements. So the location of that line indicates the element, it’s fingerprint so to speak, while the prominance of that line is an indicator of the abundance of that ion.
These indicators of specific elements were first described in 1802 by the English chemist William Hyde Wollaston (1766-1828) whose observations led to the discovery of several elements, substances that are the building blocks of matter, in the Sun. Later the German physicist Joseph von Fraunhofer (1787-1826) too noted these lines, he observed them and carefully measured them thereby identifying some 570 lines; part of his fame to this day derives from having labeled the most prominent lines with the letters A to K known as Fraunhofer Lines, these are shown on the spectrum illustration below:

Above: spectrum spanning from the vacuum ultraviolet (180nm), through visible (~370 to 700nm), and into infrared (above 900nm).
This also illustrates several of the better known Fraunhofer lines (C to K).
Colors containing only one wavelength are termed a pure or spectral color. You can see in the spectrum shown above that the spectrum does not however contain all the colors that the human eye can distinguish, this is because unsaturated colors such as pink, or purple variations such as magenta are absent for example appear only when combining multiple wavelengths. As science gained a greater understanding of the nature of things then the term spectra has been applied to well beyond the visible and to the entire electromagnetic spectrum.
What Do We Do With It? In astronomy, stellar classification includes the characterization of stars based on their chemical composition derived from studying their spectral (or elemental) characteristics. The practice has been extended to the study and classification of nebulae and other celestial bodies. Spectroscopy has helped to identify elements on Earth as well as in space. For example in 1868 English scientist Sir Joseph Norman Lockyer (1836-1920) was conducting studies of the Sun with his 6-¼ inch aperture refractor telescope that he equipped with a spectroscope. He would have observed something like the solar spectrum below:

In the spectrum of an area near the limb of the Sun he observed a prominent yellow line at 587.49 nm, after eliminating other elements as having produced that line he named the previously unknown element Helium after the Greek Helios. Later during the total solar eclipse of 18 August 1868 the French astronomer Pierre Jules César Janssen (1824-1907) independently noted the same element appearing in the spectrum of a prominence. Lockyer and Janssen were credited as co-discoverers of Helium, that was later isolated on Earth by other scientists. Incidentally, the original 6-¼ telescope lens, was removed from the original home-made optical tube installed into an improved tube assembly in 1871 that remains in use at the Norman Lockyer Observatory of the Lockyer Technology Centre & Planetarium in southwest England.
Spectroscopy: How We Do It
 As explained above, electromagnetic radiation from the star is analyzed by splitting it with either a prism or diffraction grating into a spectrum that exhibits the rainbow of colors interspersed with the absorption lines. Each line indicates an ion of a certain chemical element with the intensity of that line indicating the abundance of that ion. The relative abundance of the different ions varies with the temperature of the photosphere. The spectral class of a star is a short code that can summarize many aspects of that star including it’s stage of life, the ionization state, and this provides an objective measure of the photosphere’s temperature and of it’ density.
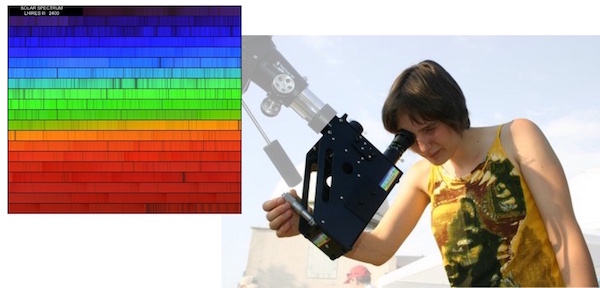
Right: Shelyak LHIRES III Spectrograph employed for solar studies, attached to a TeleVue Optics apochromat telescope (65,921 bytes).
To the left is a sample spectrograph of the Sun from the LHIRES III, note how much higher resolution data is produced than what early scientists had to work with.
Click on image to see enlarged view (87,254 bytes).
“If it emits, then you must … pull out your diffraction grating”. Martin Cohen

Emission or Absorption: the emission spectrum we observe is the spectrum of frequencies of electromagnetic radiation emitted due to an atom or molecule making the transition from a high energy state to a lower energy state. The energy of the emitted photon is equal to the energy difference between the two states. There are many possible electron transitions for each atom, and each transition has a specific energy difference. This collection of different transitions, leading to different radiated wavelengths, make up an emission spectrum. Each element's emission spectrum is unique. Therefore, spectroscopy can be used to identify the elements in matter of unknown composition. Similarly, the emission spectra of molecules can be used in chemical analysis of substances.
Spectroscopy can even be done in the privacy of your own home
Left: Ceiling lamp with tungsten filament light bulbs as it appears to the naked eye. But slip an economical diffraction grating in line between you and the camera, and WOW!
Mouse-over the image to see how the spectra are revealed by the diffraction grating, the spectra are the “fingerprint” of the elements.
Images by Company Seven, (51,520 bytes and 106,302 bytes).
Absorption spectroscopy refers to spectroscopic techniques that measure the absorption of radiation, as a function of frequency or wavelength, due to its interaction with a sample. The sample absorbs energy, i.e., photons, from the radiating field. The intensity of the absorption varies as a function of frequency, and this variation is the absorption spectrum. Absorption spectroscopy is performed across the electromagnetic spectrum. Absorption spectroscopy is employed as an analytical chemistry tool to determine the presence of a particular substance in a sample and, in many cases, to quantify the amount of the substance present. Infrared and ultraviolet-visible spectroscopy are particularly common in analytical applications. Absorption spectroscopy is also employed in studies of molecular and atomic physics, astronomical spectroscopy and remote sensing.
There are a wide range of experimental approaches to measuring absorption spectra. The most common arrangement is to direct a generated beam of radiation at a sample and detect the intensity of the radiation that passes through it. The transmitted energy can be used to calculate the absorption. The source, sample arrangement and detection technique vary significantly depending on the frequency range and the purpose of the experiment.
|
|
Shelyak Instruments: Precise Spectroscopy Instruments for Scientific Observing & Imaging
 The technology employed by the pioneering scientists were costly, and often custom made to order by specialists with some prerequisite understandings of physics and ingenious craftsmanship. Even until the recent years, this type of instrumentation was limited to professional observatories with and astronomical budget! Fortunately for you, ready access to much more precise and easier to use instruments for spectroscopy, and counsel too are only a phone call or E-Mail away at Company Seven. Our Shelyak instruments are made to work in the visible spectrum, that light which can be accumulated by conventional Earth bound telescopes. With these spectrographs you are able to deconstruct that light by passing it through a dispersive element, with these instruments through a precision grating, and by doing so one can determine the composition of the source of that light.
Spectro-heliography was formerly reserved to either professional observatories or to some amateur astronomy "home improvement" types building their own instrument. However, with the affordable Lhires III and a small video camera or webcam, it is now possible to record video of spectra while scanning the solar surface.
Not only do these instruments reveal the elements that make up the source of the light, but with a Shelyak spectrograph for example techniques can be applied to measure related activities such as the rotational period of Jupiter or Saturn where a single spectra will unveil the tilted line by the Doppler effect.
In the design of those instruments, by peopler who are also users of the technology, the team at Shelyak follow key principles:
• Simplicity and ease of use in the field.
• Scientifical: give you spectra to serve science.
• Technical quality of achieved results.
• Univeral, working with a wide range of standard equipment, even modest ones.
• Responsiveness to your needs.
• Instruments accessible to all...
... and always the pleasure of observing and discovery!
Stars send us a light rich of information, Shelyak Instruments let you decode it. The applications are infinite: amusement, educational, you may even participate in observing programs contributing to that body of knowledge collected by the scientific community. After experiencing spectroscopy first-hand, you will not look up to the stars with quite the naivety as you did before!
Shelyak Instruments: other technologies for astronomy
The team at Shelyak Instruments and Company Seven include astronomers who are enmeshed in our community and who also work with professional astronomers and researchers. This has helped our teams gain the knowledge and perspectives so that we see opportunities for new products that make our client’s lives easier or make their efforts more productive. Shelyak offers solutions for astronomical observatories that include:
The development of these instruments too has always been driven by the same core values (simplicity, performance, easy to use in the field), so that these too will facilitate your regular observations.
|

|
Contents Copyright 1994-2016 Company Seven, Shelyak Instruments and respective contributors, All Rights Reserved
|
|

)
)
)